The Connector Log
A connector's activity log is handy for troubleshooting configuration problems with your connector.
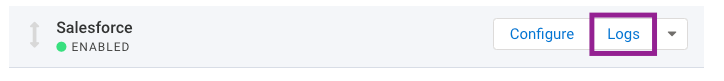
To access the log, go to the Connectors page for the desired form and click on the Logs button.
If you are already working inside of the connector, you can use the "Go to..." drop-down menu and select Log.

If you are receiving connector errors on your responses, the data is still safe in FormAssembly. Do not turn the connector off. If you are concerned about the respondents seeing errors from the other service, place the connector in Post-Submission mode.
View a Connector Log
To open a connector log, click on the connector log link from the Connectors tab or from within any connector configuration page.
Entries are color-coded:
Yellow - Information
Red - Error
Green - Success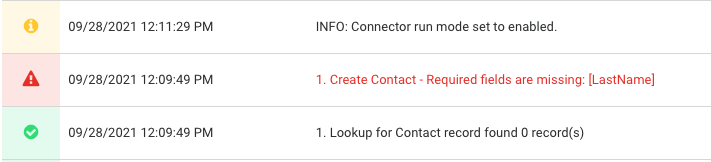
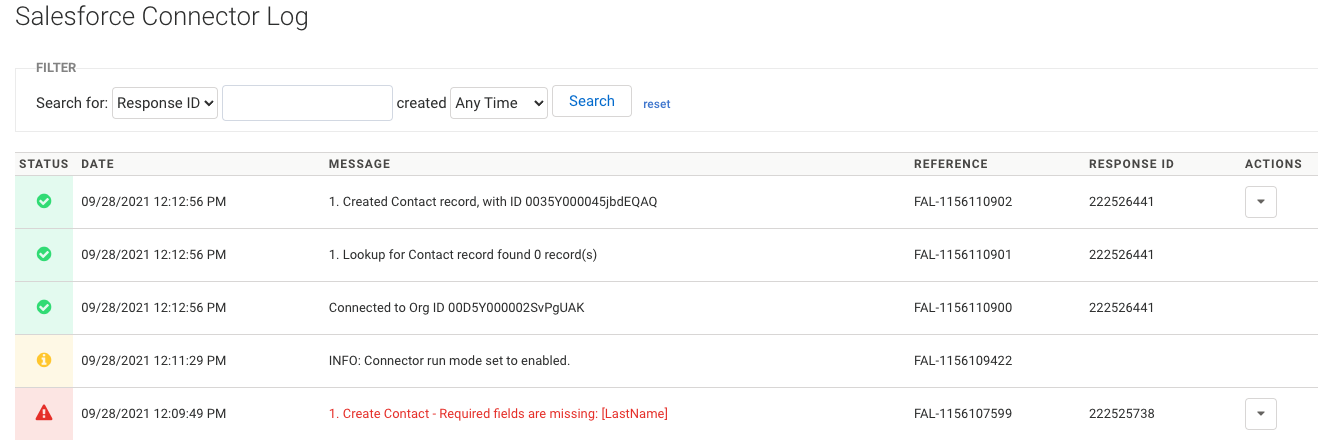
Filter Log Entries
Using the search bar at the top, you can find specific events.
Choose to filter by a time period plus one of these additional options:
Response ID | Enter a response ID to find all entries related to the response. |
|---|---|
Status | Choose to see only successful, errored, or informative entries. |
Description | Search for a specific word or phrase, like create contact or updated credentials. |
Reading the Connector Log
Each entry in the connector log will be preceded by a number that corresponds to the connector's step in your configuration. The entries will also include a time and date stamp which is controlled by your locale settings on your General Settings page.
The most recent entries appear at the top of the log.
Workflow Connector Logs
Similar to forms, logs are available for connectors within workflows. For more information, please see our article on workflow responses.